differentiation medium supplemental mix Search Results


90
Thermo Fisher neuron differentiation medium (1:1 mixture of dmem/f12 and neurobasal medium, supplemented with b-27 and n2 supplements)
Neuron Differentiation Medium (1:1 Mixture Of Dmem/F12 And Neurobasal Medium, Supplemented With B 27 And N2 Supplements), supplied by Thermo Fisher, used in various techniques. Bioz Stars score: 90/100, based on 1 PubMed citations. ZERO BIAS - scores, article reviews, protocol conditions and more
https://www.bioz.com/result/neuron differentiation medium (1:1 mixture of dmem/f12 and neurobasal medium, supplemented with b-27 and n2 supplements)/product/Thermo Fisher
Average 90 stars, based on 1 article reviews
neuron differentiation medium (1:1 mixture of dmem/f12 and neurobasal medium, supplemented with b-27 and n2 supplements) - by Bioz Stars, 2026-03
90/100 stars
  Buy from Supplier

96
PromoCell differentiation medium supplemental mix
Differentiation Medium Supplemental Mix, supplied by PromoCell, used in various techniques. Bioz Stars score: 96/100, based on 1 PubMed citations. ZERO BIAS - scores, article reviews, protocol conditions and more
https://www.bioz.com/result/differentiation medium supplemental mix/product/PromoCell
Average 96 stars, based on 1 article reviews
differentiation medium supplemental mix - by Bioz Stars, 2026-03
96/100 stars
  Buy from Supplier

90
Millipore dulbecco’s modified eagle’s medium (dmem
Dulbecco’s Modified Eagle’s Medium (Dmem, supplied by Millipore, used in various techniques. Bioz Stars score: 90/100, based on 1 PubMed citations. ZERO BIAS - scores, article reviews, protocol conditions and more
https://www.bioz.com/result/dulbecco’s modified eagle’s medium (dmem/product/Millipore
Average 90 stars, based on 1 article reviews
dulbecco’s modified eagle’s medium (dmem - by Bioz Stars, 2026-03
90/100 stars
  Buy from Supplier

90
Lonza osteogenic differentiation medium
Osteogenic Differentiation Medium, supplied by Lonza, used in various techniques. Bioz Stars score: 90/100, based on 1 PubMed citations. ZERO BIAS - scores, article reviews, protocol conditions and more
https://www.bioz.com/result/osteogenic differentiation medium/product/Lonza
Average 90 stars, based on 1 article reviews
osteogenic differentiation medium - by Bioz Stars, 2026-03
90/100 stars
  Buy from Supplier

90
Cyagen Biosciences osteogenic differentiation medium
Osteogenic Differentiation Medium, supplied by Cyagen Biosciences, used in various techniques. Bioz Stars score: 90/100, based on 1 PubMed citations. ZERO BIAS - scores, article reviews, protocol conditions and more
https://www.bioz.com/result/osteogenic differentiation medium/product/Cyagen Biosciences
Average 90 stars, based on 1 article reviews
osteogenic differentiation medium - by Bioz Stars, 2026-03
90/100 stars
  Buy from Supplier

91
GE Healthcare n2b27 medium
N2b27 Medium, supplied by GE Healthcare, used in various techniques. Bioz Stars score: 91/100, based on 1 PubMed citations. ZERO BIAS - scores, article reviews, protocol conditions and more
https://www.bioz.com/result/n2b27 medium/product/GE Healthcare
Average 91 stars, based on 1 article reviews
n2b27 medium - by Bioz Stars, 2026-03
91/100 stars
  Buy from Supplier

93
PromoCell skeletal muscle growth supplement mix
Skeletal Muscle Growth Supplement Mix, supplied by PromoCell, used in various techniques. Bioz Stars score: 93/100, based on 1 PubMed citations. ZERO BIAS - scores, article reviews, protocol conditions and more
https://www.bioz.com/result/skeletal muscle growth supplement mix/product/PromoCell
Average 93 stars, based on 1 article reviews
skeletal muscle growth supplement mix - by Bioz Stars, 2026-03
93/100 stars
  Buy from Supplier

99
Thermo Fisher nk cell differentiation b0 medium
(A) Schematic illustration of in vitro rejection assays between siRNA-treated T cells and <t>NK</t> <t>cells</t> from unrelated healthy donors. (B) Representative HLA class I expression on T cells following siRNA treatment. (C) Summary of HLA class I expression on T cells (n=4 donors in 4 independent experiments). (D) Representative killing of indicated siRNA-treated T cells by NK cells. (E) Summary of specific cytotoxicity (n=7 pairs in 5 independent experiments). (F) Representative degranulation of CD56 dim NK cells against indicated siRNA-treated T cells. (G) Summary of CD56 dim <t>NK</t> <t>cell</t> degranulation (n=7 donor pairs in 2 independent experiments). (H) Degranulation response pattern of CD56 dim NK cell sub-populations stratified for KIR2DL1, KIR2DL3, KIR3DL1, and NKG2A (mean of n=7 donor pairs in 2 independent experiments). (I) Degranulation of CD56 dim NK cell sub-populations stratified for number of receptors (n=4 donor pairs in 1 independent experiment). (J) Top: schematic illustration of synthetic HLA molecules as ligands for indicating inhibitory NK cell receptors. Bottom: schematic illustration of adhesion ligands and their cognate receptors. (K) Schematic illustration of in vitro NK cell activation experiments between genetically modified K562 target cells and PBMC. (L) Representative degranulation of viable CD14 − CD19 − CD3 − CD56 dim NK cells against indicated K562 target cells. (M) Summary of CD56 dim NK cell degranulation (left), IFN-γ expression (middle) and TNF-α expression (right). Grey shaded area indicates mean response against unmodified K562 target cells (n=17 donors in 5 independent experiments). (N) Degranulation response of indicated CD56 dim NK cell sub-populations against genetically modified K562 target cells relative to unmodified K562 target cells (n=17 donors in 5 independent experiments). (O) Frequency of donors that show reduction plotted against number of CD56 dim NK cell sub-populations that show reduction. Bubble size indicates degranulation of CD56 dim NK cells. Reduction is defined as relative decrease of at least 25% compared to unmodified K562 cell targets (n=17 donors in 5 independent experiments). C,G: paired t-test. E: Repeated measures two-way ANOVA with Šídák’s multiple comparisons test. I: Pearson correlation. M: Repeated measures one-way ANOVA with Šídák’s multiple comparisons test to unmodified K562 target cells.
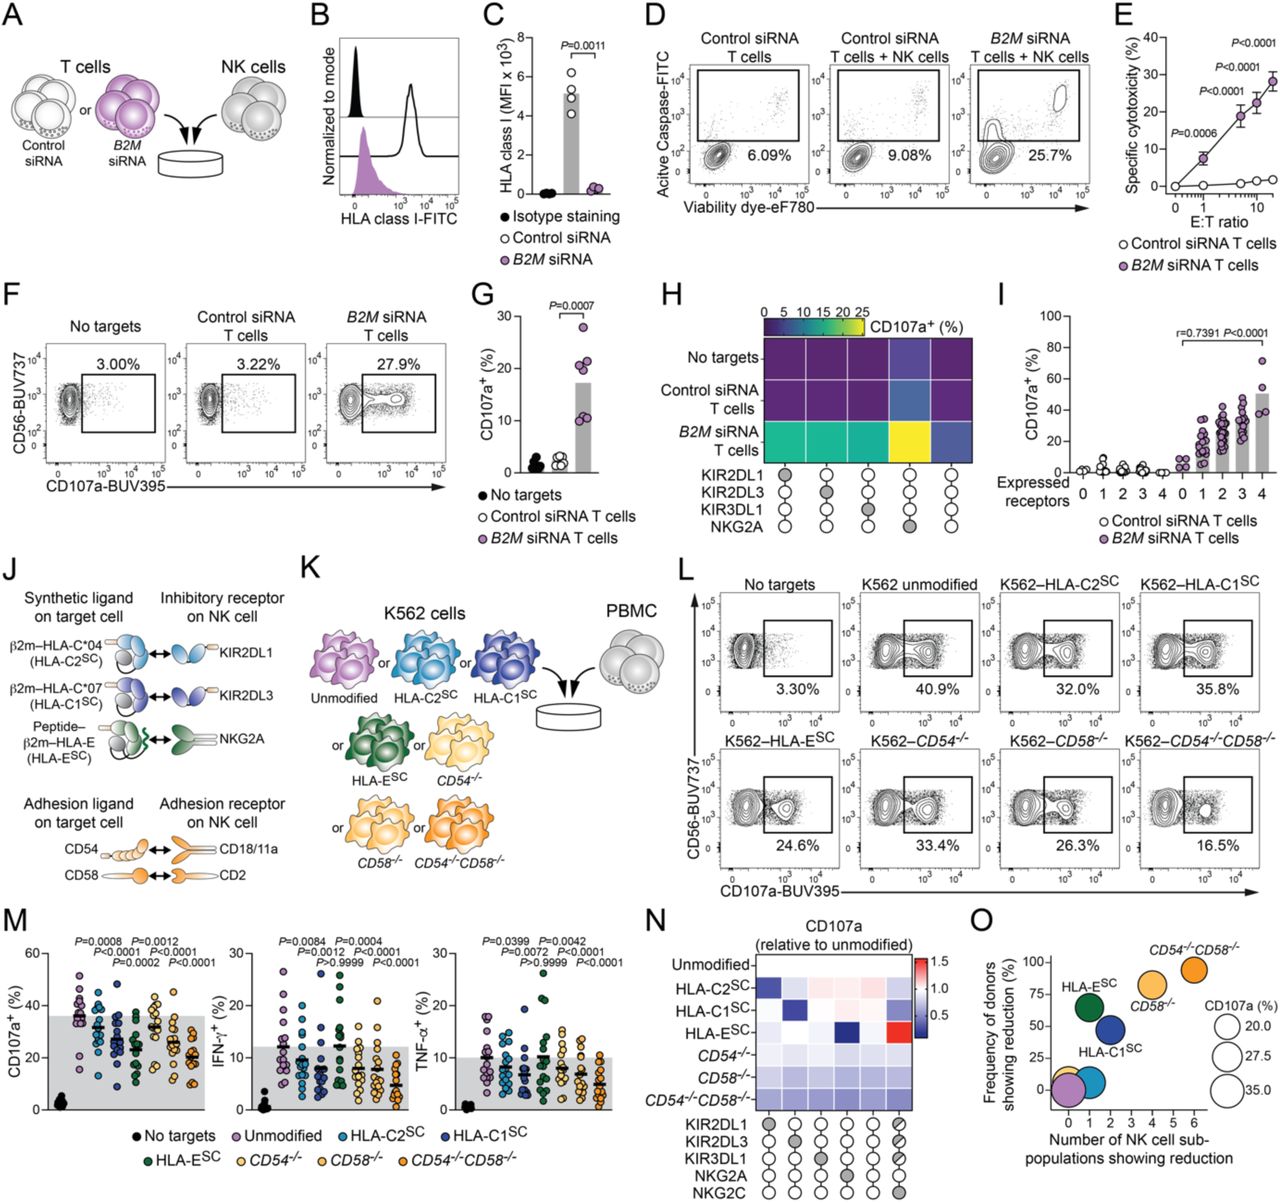
Nk Cell Differentiation B0 Medium, supplied by Thermo Fisher, used in various techniques. Bioz Stars score: 99/100, based on 1 PubMed citations. ZERO BIAS - scores, article reviews, protocol conditions and more
https://www.bioz.com/result/nk cell differentiation b0 medium/product/Thermo Fisher
Average 99 stars, based on 1 article reviews
nk cell differentiation b0 medium - by Bioz Stars, 2026-03
99/100 stars
  Buy from Supplier

90
Millipore f10 medium
(A) Schematic illustration of in vitro rejection assays between siRNA-treated T cells and <t>NK</t> <t>cells</t> from unrelated healthy donors. (B) Representative HLA class I expression on T cells following siRNA treatment. (C) Summary of HLA class I expression on T cells (n=4 donors in 4 independent experiments). (D) Representative killing of indicated siRNA-treated T cells by NK cells. (E) Summary of specific cytotoxicity (n=7 pairs in 5 independent experiments). (F) Representative degranulation of CD56 dim NK cells against indicated siRNA-treated T cells. (G) Summary of CD56 dim <t>NK</t> <t>cell</t> degranulation (n=7 donor pairs in 2 independent experiments). (H) Degranulation response pattern of CD56 dim NK cell sub-populations stratified for KIR2DL1, KIR2DL3, KIR3DL1, and NKG2A (mean of n=7 donor pairs in 2 independent experiments). (I) Degranulation of CD56 dim NK cell sub-populations stratified for number of receptors (n=4 donor pairs in 1 independent experiment). (J) Top: schematic illustration of synthetic HLA molecules as ligands for indicating inhibitory NK cell receptors. Bottom: schematic illustration of adhesion ligands and their cognate receptors. (K) Schematic illustration of in vitro NK cell activation experiments between genetically modified K562 target cells and PBMC. (L) Representative degranulation of viable CD14 − CD19 − CD3 − CD56 dim NK cells against indicated K562 target cells. (M) Summary of CD56 dim NK cell degranulation (left), IFN-γ expression (middle) and TNF-α expression (right). Grey shaded area indicates mean response against unmodified K562 target cells (n=17 donors in 5 independent experiments). (N) Degranulation response of indicated CD56 dim NK cell sub-populations against genetically modified K562 target cells relative to unmodified K562 target cells (n=17 donors in 5 independent experiments). (O) Frequency of donors that show reduction plotted against number of CD56 dim NK cell sub-populations that show reduction. Bubble size indicates degranulation of CD56 dim NK cells. Reduction is defined as relative decrease of at least 25% compared to unmodified K562 cell targets (n=17 donors in 5 independent experiments). C,G: paired t-test. E: Repeated measures two-way ANOVA with Šídák’s multiple comparisons test. I: Pearson correlation. M: Repeated measures one-way ANOVA with Šídák’s multiple comparisons test to unmodified K562 target cells.
F10 Medium, supplied by Millipore, used in various techniques. Bioz Stars score: 90/100, based on 1 PubMed citations. ZERO BIAS - scores, article reviews, protocol conditions and more
https://www.bioz.com/result/f10 medium/product/Millipore
Average 90 stars, based on 1 article reviews
f10 medium - by Bioz Stars, 2026-03
90/100 stars
  Buy from Supplier

95
TaKaRa human cord blood cd34 hematopoietic stem cell population
(A) Schematic illustration of in vitro rejection assays between siRNA-treated T cells and <t>NK</t> <t>cells</t> from unrelated healthy donors. (B) Representative HLA class I expression on T cells following siRNA treatment. (C) Summary of HLA class I expression on T cells (n=4 donors in 4 independent experiments). (D) Representative killing of indicated siRNA-treated T cells by NK cells. (E) Summary of specific cytotoxicity (n=7 pairs in 5 independent experiments). (F) Representative degranulation of CD56 dim NK cells against indicated siRNA-treated T cells. (G) Summary of CD56 dim <t>NK</t> <t>cell</t> degranulation (n=7 donor pairs in 2 independent experiments). (H) Degranulation response pattern of CD56 dim NK cell sub-populations stratified for KIR2DL1, KIR2DL3, KIR3DL1, and NKG2A (mean of n=7 donor pairs in 2 independent experiments). (I) Degranulation of CD56 dim NK cell sub-populations stratified for number of receptors (n=4 donor pairs in 1 independent experiment). (J) Top: schematic illustration of synthetic HLA molecules as ligands for indicating inhibitory NK cell receptors. Bottom: schematic illustration of adhesion ligands and their cognate receptors. (K) Schematic illustration of in vitro NK cell activation experiments between genetically modified K562 target cells and PBMC. (L) Representative degranulation of viable CD14 − CD19 − CD3 − CD56 dim NK cells against indicated K562 target cells. (M) Summary of CD56 dim NK cell degranulation (left), IFN-γ expression (middle) and TNF-α expression (right). Grey shaded area indicates mean response against unmodified K562 target cells (n=17 donors in 5 independent experiments). (N) Degranulation response of indicated CD56 dim NK cell sub-populations against genetically modified K562 target cells relative to unmodified K562 target cells (n=17 donors in 5 independent experiments). (O) Frequency of donors that show reduction plotted against number of CD56 dim NK cell sub-populations that show reduction. Bubble size indicates degranulation of CD56 dim NK cells. Reduction is defined as relative decrease of at least 25% compared to unmodified K562 cell targets (n=17 donors in 5 independent experiments). C,G: paired t-test. E: Repeated measures two-way ANOVA with Šídák’s multiple comparisons test. I: Pearson correlation. M: Repeated measures one-way ANOVA with Šídák’s multiple comparisons test to unmodified K562 target cells.
Human Cord Blood Cd34 Hematopoietic Stem Cell Population, supplied by TaKaRa, used in various techniques. Bioz Stars score: 95/100, based on 1 PubMed citations. ZERO BIAS - scores, article reviews, protocol conditions and more
https://www.bioz.com/result/human cord blood cd34 hematopoietic stem cell population/product/TaKaRa
Average 95 stars, based on 1 article reviews
human cord blood cd34 hematopoietic stem cell population - by Bioz Stars, 2026-03
95/100 stars
  Buy from Supplier

96
MedChemExpress differentiation medium
(A) Schematic illustration of in vitro rejection assays between siRNA-treated T cells and <t>NK</t> <t>cells</t> from unrelated healthy donors. (B) Representative HLA class I expression on T cells following siRNA treatment. (C) Summary of HLA class I expression on T cells (n=4 donors in 4 independent experiments). (D) Representative killing of indicated siRNA-treated T cells by NK cells. (E) Summary of specific cytotoxicity (n=7 pairs in 5 independent experiments). (F) Representative degranulation of CD56 dim NK cells against indicated siRNA-treated T cells. (G) Summary of CD56 dim <t>NK</t> <t>cell</t> degranulation (n=7 donor pairs in 2 independent experiments). (H) Degranulation response pattern of CD56 dim NK cell sub-populations stratified for KIR2DL1, KIR2DL3, KIR3DL1, and NKG2A (mean of n=7 donor pairs in 2 independent experiments). (I) Degranulation of CD56 dim NK cell sub-populations stratified for number of receptors (n=4 donor pairs in 1 independent experiment). (J) Top: schematic illustration of synthetic HLA molecules as ligands for indicating inhibitory NK cell receptors. Bottom: schematic illustration of adhesion ligands and their cognate receptors. (K) Schematic illustration of in vitro NK cell activation experiments between genetically modified K562 target cells and PBMC. (L) Representative degranulation of viable CD14 − CD19 − CD3 − CD56 dim NK cells against indicated K562 target cells. (M) Summary of CD56 dim NK cell degranulation (left), IFN-γ expression (middle) and TNF-α expression (right). Grey shaded area indicates mean response against unmodified K562 target cells (n=17 donors in 5 independent experiments). (N) Degranulation response of indicated CD56 dim NK cell sub-populations against genetically modified K562 target cells relative to unmodified K562 target cells (n=17 donors in 5 independent experiments). (O) Frequency of donors that show reduction plotted against number of CD56 dim NK cell sub-populations that show reduction. Bubble size indicates degranulation of CD56 dim NK cells. Reduction is defined as relative decrease of at least 25% compared to unmodified K562 cell targets (n=17 donors in 5 independent experiments). C,G: paired t-test. E: Repeated measures two-way ANOVA with Šídák’s multiple comparisons test. I: Pearson correlation. M: Repeated measures one-way ANOVA with Šídák’s multiple comparisons test to unmodified K562 target cells.
Differentiation Medium, supplied by MedChemExpress, used in various techniques. Bioz Stars score: 96/100, based on 1 PubMed citations. ZERO BIAS - scores, article reviews, protocol conditions and more
https://www.bioz.com/result/differentiation medium/product/MedChemExpress
Average 96 stars, based on 1 article reviews
differentiation medium - by Bioz Stars, 2026-03
96/100 stars
  Buy from Supplier

90
Tecan Systems mts mixture (100 µl differentiation medium and 20 µl mts)
(A) Schematic illustration of in vitro rejection assays between siRNA-treated T cells and <t>NK</t> <t>cells</t> from unrelated healthy donors. (B) Representative HLA class I expression on T cells following siRNA treatment. (C) Summary of HLA class I expression on T cells (n=4 donors in 4 independent experiments). (D) Representative killing of indicated siRNA-treated T cells by NK cells. (E) Summary of specific cytotoxicity (n=7 pairs in 5 independent experiments). (F) Representative degranulation of CD56 dim NK cells against indicated siRNA-treated T cells. (G) Summary of CD56 dim <t>NK</t> <t>cell</t> degranulation (n=7 donor pairs in 2 independent experiments). (H) Degranulation response pattern of CD56 dim NK cell sub-populations stratified for KIR2DL1, KIR2DL3, KIR3DL1, and NKG2A (mean of n=7 donor pairs in 2 independent experiments). (I) Degranulation of CD56 dim NK cell sub-populations stratified for number of receptors (n=4 donor pairs in 1 independent experiment). (J) Top: schematic illustration of synthetic HLA molecules as ligands for indicating inhibitory NK cell receptors. Bottom: schematic illustration of adhesion ligands and their cognate receptors. (K) Schematic illustration of in vitro NK cell activation experiments between genetically modified K562 target cells and PBMC. (L) Representative degranulation of viable CD14 − CD19 − CD3 − CD56 dim NK cells against indicated K562 target cells. (M) Summary of CD56 dim NK cell degranulation (left), IFN-γ expression (middle) and TNF-α expression (right). Grey shaded area indicates mean response against unmodified K562 target cells (n=17 donors in 5 independent experiments). (N) Degranulation response of indicated CD56 dim NK cell sub-populations against genetically modified K562 target cells relative to unmodified K562 target cells (n=17 donors in 5 independent experiments). (O) Frequency of donors that show reduction plotted against number of CD56 dim NK cell sub-populations that show reduction. Bubble size indicates degranulation of CD56 dim NK cells. Reduction is defined as relative decrease of at least 25% compared to unmodified K562 cell targets (n=17 donors in 5 independent experiments). C,G: paired t-test. E: Repeated measures two-way ANOVA with Šídák’s multiple comparisons test. I: Pearson correlation. M: Repeated measures one-way ANOVA with Šídák’s multiple comparisons test to unmodified K562 target cells.
Mts Mixture (100 µl Differentiation Medium And 20 µl Mts), supplied by Tecan Systems, used in various techniques. Bioz Stars score: 90/100, based on 1 PubMed citations. ZERO BIAS - scores, article reviews, protocol conditions and more
https://www.bioz.com/result/mts mixture (100 µl differentiation medium and 20 µl mts)/product/Tecan Systems
Average 90 stars, based on 1 article reviews
mts mixture (100 µl differentiation medium and 20 µl mts) - by Bioz Stars, 2026-03
90/100 stars
  Buy from Supplier

Image Search Results


(A) Schematic illustration of in vitro rejection assays between siRNA-treated T cells and NK cells from unrelated healthy donors. (B) Representative HLA class I expression on T cells following siRNA treatment. (C) Summary of HLA class I expression on T cells (n=4 donors in 4 independent experiments). (D) Representative killing of indicated siRNA-treated T cells by NK cells. (E) Summary of specific cytotoxicity (n=7 pairs in 5 independent experiments). (F) Representative degranulation of CD56 dim NK cells against indicated siRNA-treated T cells. (G) Summary of CD56 dim NK cell degranulation (n=7 donor pairs in 2 independent experiments). (H) Degranulation response pattern of CD56 dim NK cell sub-populations stratified for KIR2DL1, KIR2DL3, KIR3DL1, and NKG2A (mean of n=7 donor pairs in 2 independent experiments). (I) Degranulation of CD56 dim NK cell sub-populations stratified for number of receptors (n=4 donor pairs in 1 independent experiment). (J) Top: schematic illustration of synthetic HLA molecules as ligands for indicating inhibitory NK cell receptors. Bottom: schematic illustration of adhesion ligands and their cognate receptors. (K) Schematic illustration of in vitro NK cell activation experiments between genetically modified K562 target cells and PBMC. (L) Representative degranulation of viable CD14 − CD19 − CD3 − CD56 dim NK cells against indicated K562 target cells. (M) Summary of CD56 dim NK cell degranulation (left), IFN-γ expression (middle) and TNF-α expression (right). Grey shaded area indicates mean response against unmodified K562 target cells (n=17 donors in 5 independent experiments). (N) Degranulation response of indicated CD56 dim NK cell sub-populations against genetically modified K562 target cells relative to unmodified K562 target cells (n=17 donors in 5 independent experiments). (O) Frequency of donors that show reduction plotted against number of CD56 dim NK cell sub-populations that show reduction. Bubble size indicates degranulation of CD56 dim NK cells. Reduction is defined as relative decrease of at least 25% compared to unmodified K562 cell targets (n=17 donors in 5 independent experiments). C,G: paired t-test. E: Repeated measures two-way ANOVA with Šídák’s multiple comparisons test. I: Pearson correlation. M: Repeated measures one-way ANOVA with Šídák’s multiple comparisons test to unmodified K562 target cells.

Journal: bioRxiv

Article Title: Genetic ablation of adhesion ligands averts rejection of allogeneic immune cells

doi: 10.1101/2023.10.09.557143

Figure Lengend Snippet: (A) Schematic illustration of in vitro rejection assays between siRNA-treated T cells and NK cells from unrelated healthy donors. (B) Representative HLA class I expression on T cells following siRNA treatment. (C) Summary of HLA class I expression on T cells (n=4 donors in 4 independent experiments). (D) Representative killing of indicated siRNA-treated T cells by NK cells. (E) Summary of specific cytotoxicity (n=7 pairs in 5 independent experiments). (F) Representative degranulation of CD56 dim NK cells against indicated siRNA-treated T cells. (G) Summary of CD56 dim NK cell degranulation (n=7 donor pairs in 2 independent experiments). (H) Degranulation response pattern of CD56 dim NK cell sub-populations stratified for KIR2DL1, KIR2DL3, KIR3DL1, and NKG2A (mean of n=7 donor pairs in 2 independent experiments). (I) Degranulation of CD56 dim NK cell sub-populations stratified for number of receptors (n=4 donor pairs in 1 independent experiment). (J) Top: schematic illustration of synthetic HLA molecules as ligands for indicating inhibitory NK cell receptors. Bottom: schematic illustration of adhesion ligands and their cognate receptors. (K) Schematic illustration of in vitro NK cell activation experiments between genetically modified K562 target cells and PBMC. (L) Representative degranulation of viable CD14 − CD19 − CD3 − CD56 dim NK cells against indicated K562 target cells. (M) Summary of CD56 dim NK cell degranulation (left), IFN-γ expression (middle) and TNF-α expression (right). Grey shaded area indicates mean response against unmodified K562 target cells (n=17 donors in 5 independent experiments). (N) Degranulation response of indicated CD56 dim NK cell sub-populations against genetically modified K562 target cells relative to unmodified K562 target cells (n=17 donors in 5 independent experiments). (O) Frequency of donors that show reduction plotted against number of CD56 dim NK cell sub-populations that show reduction. Bubble size indicates degranulation of CD56 dim NK cells. Reduction is defined as relative decrease of at least 25% compared to unmodified K562 cell targets (n=17 donors in 5 independent experiments). C,G: paired t-test. E: Repeated measures two-way ANOVA with Šídák’s multiple comparisons test. I: Pearson correlation. M: Repeated measures one-way ANOVA with Šídák’s multiple comparisons test to unmodified K562 target cells.

Article Snippet: In brief, iPSC-derived CD34 + cells were transferred to NK cell differentiation B0 medium (2:1 mixture of Dulbecco modified Eagle medium and Ham F12 medium supplemented with 2 mM L-glutamine, 100 U/mL penicillin, and 100 μg/mL streptomycin, 25 uM β-mercaptoethanol, 10% [V/V] human AB serum, 5 ng/ml sodium selenite, 50 uM ethanolamine, 20 mg/ml ascorbic acid [all ThermoFisher], 5 ng/mL IL-3 [first week only; ThermoFisher], 30 ng/mL stem cell factor [SCF ThermoFisher], 20 ng/mL IL-15 [RnD], and 10 ng/mL Fml-like tyrosine kinase 3 ligand [FLT3L; ThermoFisher]).

Techniques: In Vitro, Expressing, Activation Assay, Genetically Modified

(A) Schematic illustration of conjugation and cytotoxicity assays between K562 cells and NK cells. (B) Representative conjugate formation of CFSE-labelled NK cells to CellTrace Violet-labelled target cells. (C) Summary of conjugate formation (n=8 donors in 3 independent experiments). (D) Representative killing of target cells by NK cells. (E) Summary of specific cytotoxicity (n=8 donors in 4 independent experiments). (F) Schematic illustration of in vitro microwell assays between K562 cells and NK cells. (G) Representative display of co-cultures between single NK cells and multiple K562 cells over time. Scale bar 10 μm. (H) Summary of relative time of NK cells spent in contact with target cells (n=4 donors in 3 independent experiments). (I) Summary of relative NK cell cytotoxicity (n=4 donors in 3 independent experiments). (J) Schematic illustration of in vitro conjugation and cytotoxicity assays between mixed K562 cells and NK cells. (K) Representative deconvolution of mixed target cells based on CellTrace Violet intensity. (L) Summary of distribution of target cell type within formed conjugates (n=8 donors in 5 independent experiments). (M) Summary of distribution of target cell type within surviving target cells in cytotoxicity assays (n=8 donors in 4 independent experiments). (N) Schematic illustration of in vitro microwell assays between mixed K562 cells and NK cells. (O) Representative display of co-cultures between single NK cells and multiple mixed target cells over time. Scale bar 10 μm. (P) Summary of distribution of target cell type killed in first cytotoxic event (n=335 individual NK cells; n=4 donors in 3 independent experiments). (Q, R) Sequential killing of mixed target cells by single NK cells. (Q) Distribution of target cell types with which single NK cells form contacts but do not kill prior to killing another target cell (n=39 sparing events prior to a kill; n=4 donors in 3 independent experiments). (R) Distribution of target cell types which single NK cells kill after having spared another target cell (n=39 killing events following a spare; n=4 donors in 3 independent experiments). C, E, L, M: Repeated measures two-way ANOVA with Šídák’s multiple comparisons test. H, I: Paired t-test.

Journal: bioRxiv

Article Title: Genetic ablation of adhesion ligands averts rejection of allogeneic immune cells

doi: 10.1101/2023.10.09.557143

Figure Lengend Snippet: (A) Schematic illustration of conjugation and cytotoxicity assays between K562 cells and NK cells. (B) Representative conjugate formation of CFSE-labelled NK cells to CellTrace Violet-labelled target cells. (C) Summary of conjugate formation (n=8 donors in 3 independent experiments). (D) Representative killing of target cells by NK cells. (E) Summary of specific cytotoxicity (n=8 donors in 4 independent experiments). (F) Schematic illustration of in vitro microwell assays between K562 cells and NK cells. (G) Representative display of co-cultures between single NK cells and multiple K562 cells over time. Scale bar 10 μm. (H) Summary of relative time of NK cells spent in contact with target cells (n=4 donors in 3 independent experiments). (I) Summary of relative NK cell cytotoxicity (n=4 donors in 3 independent experiments). (J) Schematic illustration of in vitro conjugation and cytotoxicity assays between mixed K562 cells and NK cells. (K) Representative deconvolution of mixed target cells based on CellTrace Violet intensity. (L) Summary of distribution of target cell type within formed conjugates (n=8 donors in 5 independent experiments). (M) Summary of distribution of target cell type within surviving target cells in cytotoxicity assays (n=8 donors in 4 independent experiments). (N) Schematic illustration of in vitro microwell assays between mixed K562 cells and NK cells. (O) Representative display of co-cultures between single NK cells and multiple mixed target cells over time. Scale bar 10 μm. (P) Summary of distribution of target cell type killed in first cytotoxic event (n=335 individual NK cells; n=4 donors in 3 independent experiments). (Q, R) Sequential killing of mixed target cells by single NK cells. (Q) Distribution of target cell types with which single NK cells form contacts but do not kill prior to killing another target cell (n=39 sparing events prior to a kill; n=4 donors in 3 independent experiments). (R) Distribution of target cell types which single NK cells kill after having spared another target cell (n=39 killing events following a spare; n=4 donors in 3 independent experiments). C, E, L, M: Repeated measures two-way ANOVA with Šídák’s multiple comparisons test. H, I: Paired t-test.

Article Snippet: In brief, iPSC-derived CD34 + cells were transferred to NK cell differentiation B0 medium (2:1 mixture of Dulbecco modified Eagle medium and Ham F12 medium supplemented with 2 mM L-glutamine, 100 U/mL penicillin, and 100 μg/mL streptomycin, 25 uM β-mercaptoethanol, 10% [V/V] human AB serum, 5 ng/ml sodium selenite, 50 uM ethanolamine, 20 mg/ml ascorbic acid [all ThermoFisher], 5 ng/mL IL-3 [first week only; ThermoFisher], 30 ng/mL stem cell factor [SCF ThermoFisher], 20 ng/mL IL-15 [RnD], and 10 ng/mL Fml-like tyrosine kinase 3 ligand [FLT3L; ThermoFisher]).

Techniques: Conjugation Assay, In Vitro

(A) Representative staining of CD54 and CD58 on resting (left) and activated (right) CAR T cells. (B) Representative staining of CD54 and CD58 on activated CAR T cells either unmodified (left), B2M -deficient (middle), or combined deletions of B2M , CD54 , and CD58 (right). (C) Schematic illustration of in vitro anti-tumor functional assay of genetically modified CAR T cells. (D) Cytotoxicity of indicated CAR T cells against Nalm-6 target cells for 18 h at varying E:T ratios. (E) Cytotoxicity of indicated CAR T cells against Nalm-6 target cells for 46 h at E:T= 1 (n=1 experiment). (F) Schematic illustration of in vitro rejection assays between CAR T cells and NK cells. (G) Summary of CAR T cell survival relative to B2M −/− CAR T cells upon co-culture with NK cells (n=9 donors in 3 independent experiments). (H) Schematic illustration of in vivo rejection assays between CAR T cells and PBMC engrafted into human IL-15-transgenic NSG mice. (I) Summary of CAR T cell persistence relative to B2M −/− CAR T cells 7 days post transfer (n=10 animals without PBMC engraftment and n=17 animals with PBMC engraftment). G, I: One-sample t-test to CAR T B2M −/− .

Journal: bioRxiv

Article Title: Genetic ablation of adhesion ligands averts rejection of allogeneic immune cells

doi: 10.1101/2023.10.09.557143

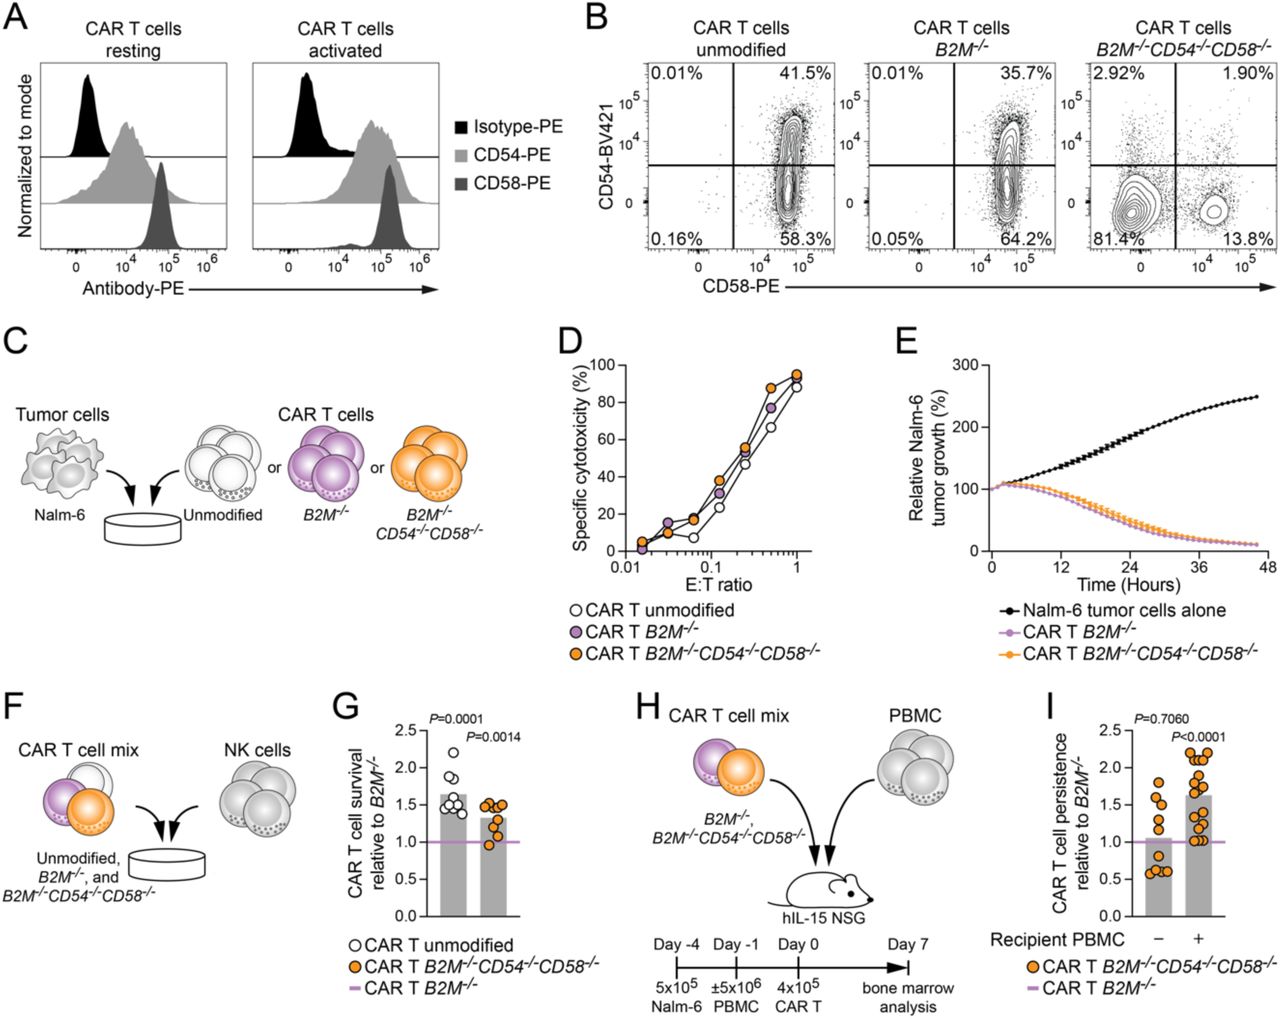
Figure Lengend Snippet: (A) Representative staining of CD54 and CD58 on resting (left) and activated (right) CAR T cells. (B) Representative staining of CD54 and CD58 on activated CAR T cells either unmodified (left), B2M -deficient (middle), or combined deletions of B2M , CD54 , and CD58 (right). (C) Schematic illustration of in vitro anti-tumor functional assay of genetically modified CAR T cells. (D) Cytotoxicity of indicated CAR T cells against Nalm-6 target cells for 18 h at varying E:T ratios. (E) Cytotoxicity of indicated CAR T cells against Nalm-6 target cells for 46 h at E:T= 1 (n=1 experiment). (F) Schematic illustration of in vitro rejection assays between CAR T cells and NK cells. (G) Summary of CAR T cell survival relative to B2M −/− CAR T cells upon co-culture with NK cells (n=9 donors in 3 independent experiments). (H) Schematic illustration of in vivo rejection assays between CAR T cells and PBMC engrafted into human IL-15-transgenic NSG mice. (I) Summary of CAR T cell persistence relative to B2M −/− CAR T cells 7 days post transfer (n=10 animals without PBMC engraftment and n=17 animals with PBMC engraftment). G, I: One-sample t-test to CAR T B2M −/− .

Article Snippet: In brief, iPSC-derived CD34 + cells were transferred to NK cell differentiation B0 medium (2:1 mixture of Dulbecco modified Eagle medium and Ham F12 medium supplemented with 2 mM L-glutamine, 100 U/mL penicillin, and 100 μg/mL streptomycin, 25 uM β-mercaptoethanol, 10% [V/V] human AB serum, 5 ng/ml sodium selenite, 50 uM ethanolamine, 20 mg/ml ascorbic acid [all ThermoFisher], 5 ng/mL IL-3 [first week only; ThermoFisher], 30 ng/mL stem cell factor [SCF ThermoFisher], 20 ng/mL IL-15 [RnD], and 10 ng/mL Fml-like tyrosine kinase 3 ligand [FLT3L; ThermoFisher]).

Techniques: Staining, In Vitro, Functional Assay, Genetically Modified, Co-Culture Assay, In Vivo, Transgenic Assay

(A) Representative staining of HLA class I and HLA class II on viable CD45 + CD56 + iPSC-derived NK cells either expressing CD19-CAR, IL-15/IL-15Ra, and hnCD16 alone (unmodified; left), or combined with genetic deletion of B2M and CIITA (middle), or combined with genetic deletion of B2M , CIITA , CD54 , and CD58 (right). (B) Representative staining of CD54 and CD58 on viable CD45 + CD56 + iPSC-derived NK cells with indicated genotype. (C) Schematic illustration of in vitro anti-tumor functional assay of iPSC-derived NK cells. Representative (D) degranulation, (E) IFN-γ expression, (F) TNF-α expression, of viable CD45 + CD56 + iPSC-derived NK cells with indicated genotype upon co-culture with K562 tumor target cells (n=1 experiment). (G) Schematic illustration of in vitro rejection assays between iPSC-derived NK cells and NK cells. (H) Summary of specific cytotoxicity against the indicated iPSC-derived NK cells (n=4 donors in 2 independent experiments). (I) Summary of CD56 dim NK cell degranulation against the indicated iPSC-derived NK cells (n=6 donors in 2 independent experiments). (J) Degranulation response pattern of CD56 dim NK cell sub-populations stratified for KIR2DL1, KIR2DL3, KIR3DL1, and NKG2A (mean of n=6 donor pairs in 2 independent experiments). (K) Schematic illustration of in vivo rejection assays between iPSC-derived NK cells and activated NK cells engrafted into human IL-15-transgenic NSG mice. (O) Summary of iPSC-derived NK cell persistence relative to animals without recipient NK cell engraftment (n=9-10 animals per group in 2 independent experiments). (P) Schematic illustration of rejection of B2M −/− allogeneic cells by recipient NK cells (top) and averting of rejection by combining B2M −/− with deletion of CD54 and CD58. H, I: Repeated measures two-way ANOVA with Šídák’s multiple comparisons test. L: Ordinary one-way ANOVA with Šídák’s multiple comparisons test.

Journal: bioRxiv

Article Title: Genetic ablation of adhesion ligands averts rejection of allogeneic immune cells

doi: 10.1101/2023.10.09.557143

Figure Lengend Snippet: (A) Representative staining of HLA class I and HLA class II on viable CD45 + CD56 + iPSC-derived NK cells either expressing CD19-CAR, IL-15/IL-15Ra, and hnCD16 alone (unmodified; left), or combined with genetic deletion of B2M and CIITA (middle), or combined with genetic deletion of B2M , CIITA , CD54 , and CD58 (right). (B) Representative staining of CD54 and CD58 on viable CD45 + CD56 + iPSC-derived NK cells with indicated genotype. (C) Schematic illustration of in vitro anti-tumor functional assay of iPSC-derived NK cells. Representative (D) degranulation, (E) IFN-γ expression, (F) TNF-α expression, of viable CD45 + CD56 + iPSC-derived NK cells with indicated genotype upon co-culture with K562 tumor target cells (n=1 experiment). (G) Schematic illustration of in vitro rejection assays between iPSC-derived NK cells and NK cells. (H) Summary of specific cytotoxicity against the indicated iPSC-derived NK cells (n=4 donors in 2 independent experiments). (I) Summary of CD56 dim NK cell degranulation against the indicated iPSC-derived NK cells (n=6 donors in 2 independent experiments). (J) Degranulation response pattern of CD56 dim NK cell sub-populations stratified for KIR2DL1, KIR2DL3, KIR3DL1, and NKG2A (mean of n=6 donor pairs in 2 independent experiments). (K) Schematic illustration of in vivo rejection assays between iPSC-derived NK cells and activated NK cells engrafted into human IL-15-transgenic NSG mice. (O) Summary of iPSC-derived NK cell persistence relative to animals without recipient NK cell engraftment (n=9-10 animals per group in 2 independent experiments). (P) Schematic illustration of rejection of B2M −/− allogeneic cells by recipient NK cells (top) and averting of rejection by combining B2M −/− with deletion of CD54 and CD58. H, I: Repeated measures two-way ANOVA with Šídák’s multiple comparisons test. L: Ordinary one-way ANOVA with Šídák’s multiple comparisons test.

Article Snippet: In brief, iPSC-derived CD34 + cells were transferred to NK cell differentiation B0 medium (2:1 mixture of Dulbecco modified Eagle medium and Ham F12 medium supplemented with 2 mM L-glutamine, 100 U/mL penicillin, and 100 μg/mL streptomycin, 25 uM β-mercaptoethanol, 10% [V/V] human AB serum, 5 ng/ml sodium selenite, 50 uM ethanolamine, 20 mg/ml ascorbic acid [all ThermoFisher], 5 ng/mL IL-3 [first week only; ThermoFisher], 30 ng/mL stem cell factor [SCF ThermoFisher], 20 ng/mL IL-15 [RnD], and 10 ng/mL Fml-like tyrosine kinase 3 ligand [FLT3L; ThermoFisher]).

Techniques: Staining, Derivative Assay, Expressing, In Vitro, Functional Assay, Co-Culture Assay, In Vivo, Transgenic Assay